
管理人オススメコンテンツはこちら
「なぜそうなるのか!?|〇〇が1位!? “お金持ち”の意外な使い道」
〜前回のつづき〜
●32,000人に調査!お小遣いの実態は!?(つづき)
日経トレンディでは
なかなか面白い独自の視点で
この辺を分析してるんですね。
お小遣いが
月10万円以上の人達を
『富裕層』と定義して
富裕層と平均的な人達の
比較をしてるんですね。
その発想は無かった。
つまり
お小遣いがいっぱい使えたら
富裕層で
・実家暮らしの独身者が自分で稼いだお金は全部自分で使う
・旦那と共働きで旦那の稼ぎで生活しつつ自分の稼ぎは全部自分のために使う
みたいな人達が
富裕層の定義に入ってくる。
今回の
お小遣い富裕層の
定義に入ってくるという事ですね。
そういう人達が
お金を何に使ってるかというのは
確かに興味深いですよね?
一体何に使ってるんだろう?
生活費なんかは
実家だから大丈夫という人が
稼いだお金を一体全部
それだけお小遣いが増えて
何に使っているのか?
見ていきましょう。
●お小遣い10万円以上の富裕層達について
お小遣いが
月に10万円以上の人達は
32,000人のうち
約2,500人とのことで
上位8%の水準なんですね。
この人達の特徴を見ていきましょう。
まずは年収なんですけど
平均世代年収:940万円
平均個人年収:600万円
という事で
やはり上位8%に入るだけあって
かなり稼いでいる方だと
言えるのではないかと思います。
一般的なサラリーマンよりは
大分稼いでいる方ではないかと
思います。
気になる
お小遣いの額はなんと
お小遣い富裕層の平均は
13.9万円と
普通の人達よりも
10万円も多い訳ですね。
ではその約14万円を
一体何に注ぎ込んでいるのか?
という事なんですけど
全体平均と比べて
富裕層がお金を使ってる
分野トップ3はこれです。
第1位:ギャンブル
第2位:外食
第3位:ファッション関連商品
これに
お金を使っているそうですね。
なぜそうなるのか!?
なぜ第1位が
ギャンブルなんだって思います。
毎月の金額はこんな感じだそうで
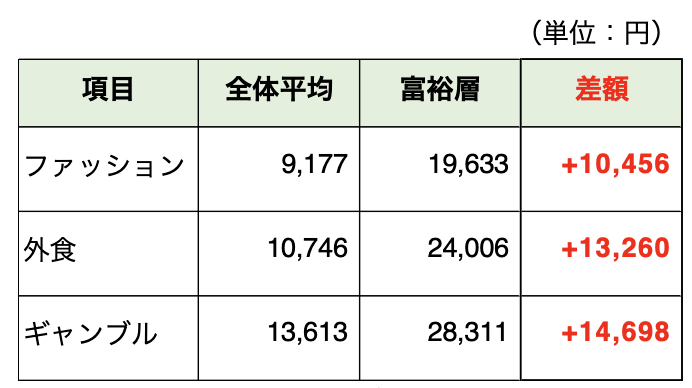
(出典:https://xtrend.nikkei.com/atcl/contents/18/00235/00001/)
全体平均のところが
一般的な平均で
右側の縦の欄が富裕層です。
差額が大分
それぞれ
・外食
・ファッション
・ギャンブル
など使う所が有るんですけど
お小遣いを増やして
・宝くじ
・ロト6
・TOTO
・競馬
などのギャンブルに没頭する。
公営ギャンブルは
国の取り分が50%ぐらい
有るんですよね。
だから『愚か者の税金』と
呼ばれてるんですね。
これについては以前
↑この回でお話ししてます。
〜〜〜つづく〜〜〜
Special Thanks college president Ryo.
●おまけ
≪≪perplexityちゃんによる文章まとめ≫≫
日経トレンディの調査によると、お小遣いが月10万円以上の人を「富裕層」と定義し、約32,000人中2,500人(約8%)が該当します。
彼らの平均個人年収は約600万円で、世帯年収は約940万円と高水準です。
この富裕層のお小遣い平均額は約13.9万円で、一般層と比べて約10万円多く使っています。
興味深いのは、彼らがお小遣いを何に使っているかという点で、支出のトップ3はギャンブル、外食、そしてファッション関連商品です。
特にギャンブルへの支出が多く、宝くじや競馬、ロト6などが人気です。
公営ギャンブルは国の取り分がおよそ50%で、「愚か者の税金」と呼ばれることもあります。
生活費をかけずに自分の稼ぎを自由に使える人が多いことも特徴です。
- https://xtrend.nikkei.com/atcl/contents/18/00235/00001/
- https://xtrend.nikkei.com/atcl/contents/18/00651/
- https://xtrend.nikkei.com/atcl/contents/18/00651/00001/
- https://xtrend.nikkei.com/atcl/contents/18/00235/00004/
- https://xtrend.nikkei.com/atcl/contents/18/00235/00003/
- https://www.fujisan.co.jp/product/1936/b/list/?page=5
- https://xtrend.nikkei.com/atcl/contents/18/00235/00002/
- https://fpcafe.jp/mocha/1710
- https://xtrend.nikkei.com/atcl/contents/18/00589/00196/
≪≪Chat-GPTくんによる英訳≫≫
~Continuation from the previous part~
【Survey of 32,000 people! What’s the reality of their spending money? (Continued)】
Nikkei Trendy provides an interesting and unique perspective in its analysis of this topic.
They define people who spend more than 100,000 yen (approx. \$900 USD) per month in discretionary spending as the “affluent group”, and compare them to the average population.
That’s a perspective I hadn’t considered before.
In other words, if you have a lot of spending money, you’re considered affluent.
For example:
A single person living with their parents, who can spend all of their income freely
A married woman in a dual-income household, who uses her husband’s earnings for living expenses and keeps her own income entirely for herself
These kinds of people fall into this “affluent” definition.
So, they’re classified as part of this “affluent group with a high allowance.”
It’s definitely intriguing to consider what these people are spending all that money on, right?
If they don’t have to pay for living expenses because they live with their parents, where does all of their income—and increased spending money—go?
Let’s take a look.
—
【About the Affluent Group with Over 100,000 Yen in Spending Money】
Among the 32,000 survey respondents,
about 2,500 people reported having more than 100,000 yen in monthly spending money.
That’s roughly the top 8%.
Let’s take a closer look at their characteristics.
First, their income:
Average household income: 9.4 million yen (\~\$62,000 USD/year)
Average individual income: 6 million yen (\~\$40,000 USD/year)
As expected from the top 8%, they’re clearly earning a lot.
They’re definitely making significantly more than the average office worker.
Now, as for their spending money:
The average monthly allowance for this affluent group is 139,000 yen (\~\$950 USD),
which is about 100,000 yen more than the average person.
So where does that roughly 140,000 yen go?
Compared to the overall average, the top 3 categories where affluent individuals spend their money are:
1. Gambling
2. Dining out
3. Fashion-related items
That’s what they’re spending money on.
But why is that?
Why is gambling ranked number one?
Here’s a breakdown of the monthly spending (based on the source below):
(Source: [https://xtrend.nikkei.com/atcl/contents/18/00235/00001/](https://xtrend.nikkei.com/atcl/contents/18/00235/00001/))
The left column shows the general average,
while the right column represents the affluent group.
There’s a significant difference in spending on:
Dining out
Fashion
Gambling
As their discretionary funds increase, they become more immersed in gambling such as:
Lotteries
Lotto 6
Sports betting (TOTO)
Horse racing
It’s worth noting that public gambling operations keep about 50% of the money spent as government revenue.
That’s why it’s often called a “tax on the foolish.”
(See Episode #57: “Lotteries: A Tax on the Foolish – Part 1”)
Special Thanks OpenAI and Perplexity AI, Inc